


Financial Analysis Report For the Year Ended 30 June 2026
July 28, 2026 | by Mohmmed Ismail Miah

Ready-Made Garments (RMG) Industry in Bangladesh

Ready-Made Garments (RMG) Industry in Bangladesh
Executive Financial Analysis Report
Statement of Financial Position, Comprehensive Income, Changes in Equity & Cash Flows
For the Year Ended 30 June 2026 (with comparatives for 30 June 2025)
Currency: Bangladeshi Taka (BDT) | Financial Year: 1 July – 30 June
1. Executive Summary
1.1 Financial Overview
Ready-Made Garments (RMG) Industry in Bangladesh
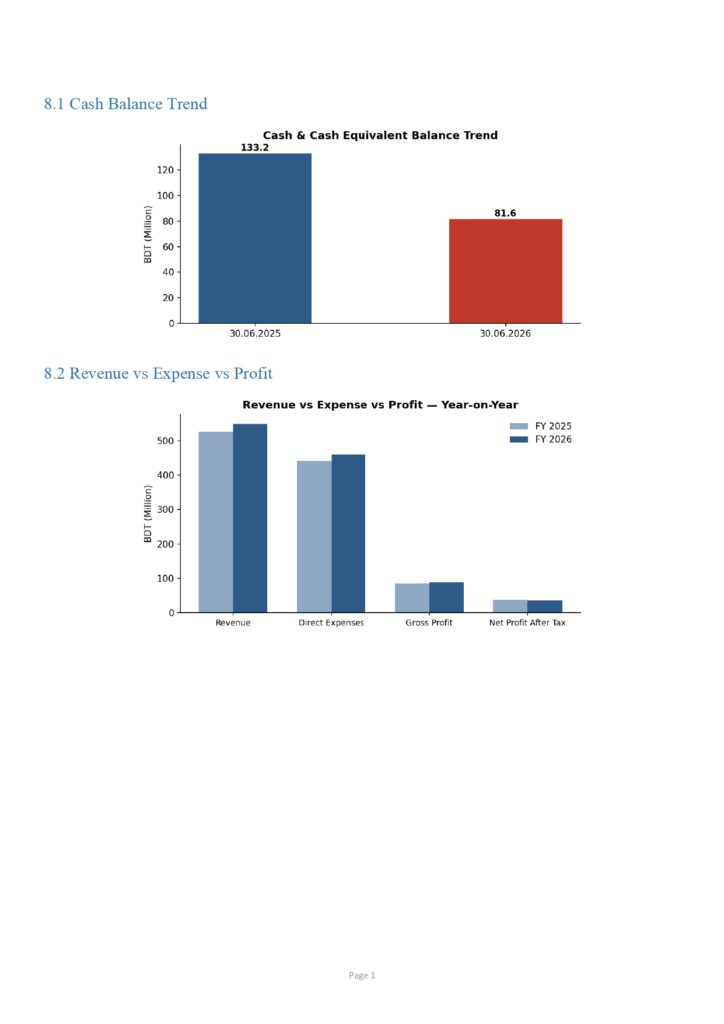
is a garment/apparel exporter operating on a 1 July–30 June financial year. For FY2025-26, the Company reported export revenue of BDT 548,927,697, up 4.47% year-on-year, with gross profit of BDT 89,312,950 (margin 16.27%, up from 16.20%). Operating profit rose sharply by 22.08% to BDT 40,346,005, reflecting improved cost discipline in administrative and financial expenses relative to sales. However, net profit after tax declined 8.82% to BDT 35,354,231 (from BDT 38,774,398), because FY2025 benefited from a one-off cash incentive of BDT 11,391,400 that did not recur in FY2026.
1.2 Key Findings
- Revenue growth of 4.47% was achieved with a stable gross margin (16.27% vs 16.20%), indicating pricing and cost-of-goods discipline was maintained despite input cost pressure.
- Core operating performance strengthened materially — operating profit grew 22.08% — but bottom-line net profit fell 8.82% purely due to the absence of the prior year’s one-off cash incentive income; underlying operations improved.
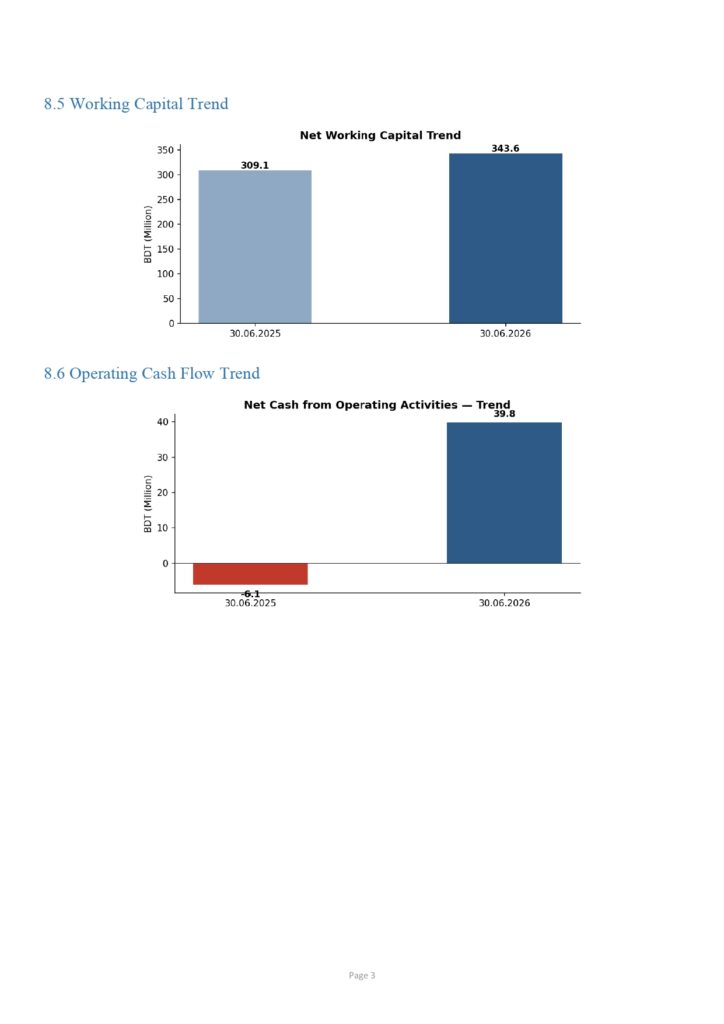
- Operating cash flow turned strongly positive at BDT 39,849,285 versus a negative BDT (6,116,271) in FY2025 — a swing of over BDT 45.9 million — driven by working capital normalisation (smaller build-up in receivables).
- The Company aggressively deleveraged during the year: working capital loans fell by BDT 70.1 million and long-term bank loans by BDT 18.1 million, funded from operating cash flow and reduced cash reserves.
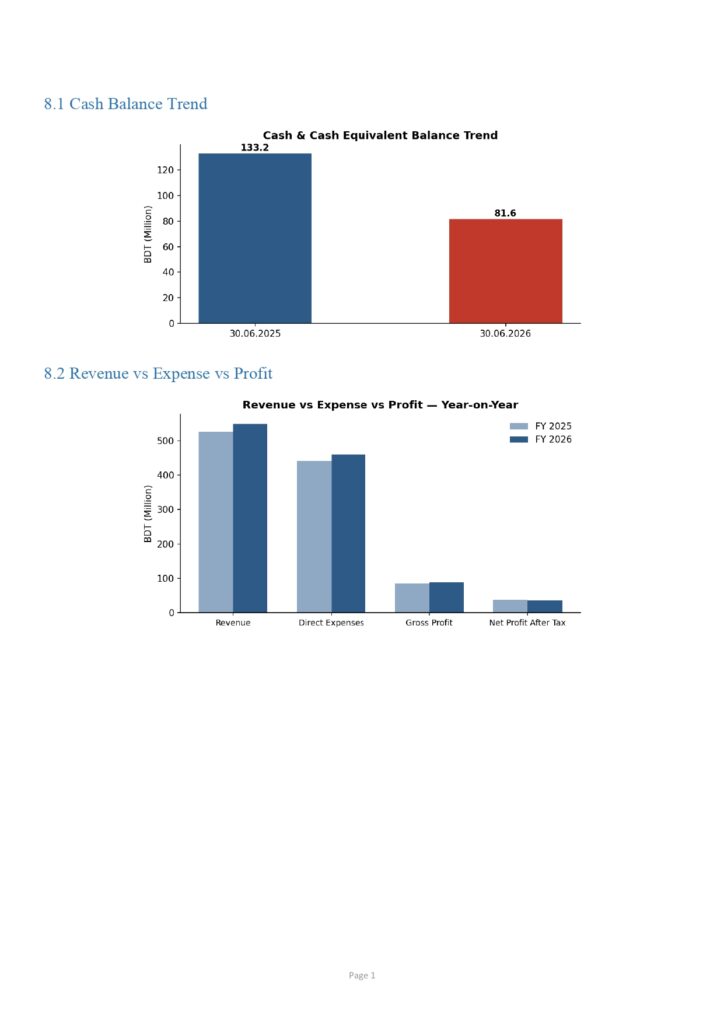
- Cash and cash equivalents declined 38.78% to BDT 81,552,831 (from BDT 133,202,526) as cash was deployed to reduce financing-activity balances rather than held on the balance sheet.
- Total assets contracted 5.52% to BDT 828,880,404, mainly reflecting lower fixed assets (no capital expenditure was recorded — zero investing activity) and the cash decline.
1.3 Business Performance
Top-line growth combined with margin stability and a marked improvement in operating leverage (7.35% operating margin vs 6.29%) reflects a business that is growing its core export operations profitably. The decline in reported net profit is a composition effect (loss of non-recurring other income), not a deterioration of the underlying trade.
1.4 Cash Position
Closing cash and cash equivalents stood at BDT 81,552,831 (30 June 2026) versus BDT 133,202,526 (30 June 2025), a decrease of BDT 51,649,695. The decrease is fully explained by the Statement of Cash Flows: strong operating inflow of BDT 39.8 million and nil investing activity were more than offset by BDT 91.5 million of net cash used in financing activities (debt repayment).
1.5 Liquidity Position
Liquidity strengthened on a ratio basis: the current ratio improved to 2.11x (from 1.83x) and the quick ratio to 1.72x (from 1.51x), both comfortably above the conventional 1.0x–2.0x benchmark range. However, the cash ratio declined to 0.26x (from 0.36x), and a very large proportion of current assets (BDT 448.1 million, 68.7% of current assets) is tied up in advances, deposits and receivables rather than liquid cash — a point requiring management attention (see Risk Assessment).
1.6 Working Capital Status
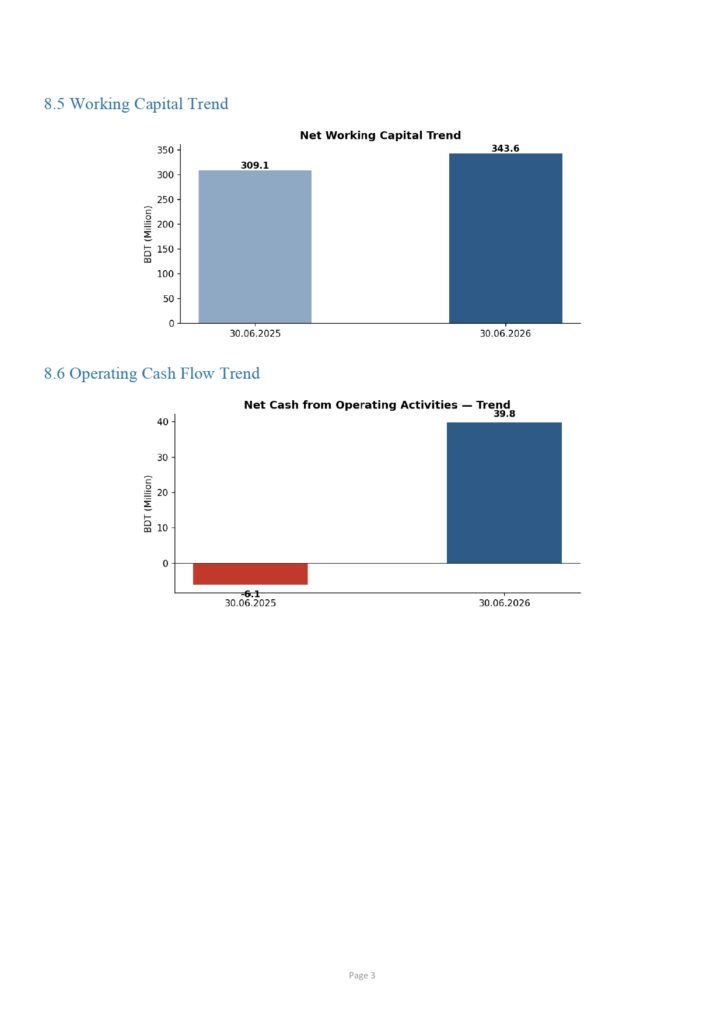
Net working capital increased to BDT 343,609,426 (from BDT 309,072,664), a healthy and improving position in absolute terms. The composition, however, shows working capital is receivables-heavy rather than cash-heavy, which management should actively monitor for realisability.
2. Professional Financial Statements
2.1 Statement of Financial Position (Balance Sheet)
| Particulars | Note | 30.06.2026 (BDT) | 30.06.2025 (BDT) |
| **Non-Current Assets** | |||
| Fixed Assets (at cost less depreciation) | 4 | 176,753,819 | 194,045,531 |
| **Current Assets** | |||
| Inventory | 5 | 122,511,435 | 119,543,428 |
| Advance, Deposits and Receivables | 6 | 448,062,318 | 430,553,433 |
| Cash and Cash Equivalents | 7 | 81,552,831 | 133,202,526 |
| **Total Current Assets** | **652,126,584** | **683,299,387** | |
| **TOTAL ASSETS** | **828,880,404** | **877,344,918** | |
| **Shareholders’ Equity** | |||
| Share Capital | 8 | 60,000,000 | 60,000,000 |
| Accumulated Profit | 212,388,272 | 177,034,042 | |
| **Total Equity** | **272,388,272** | **237,034,042** | |
| **Non-Current Liabilities** | |||
| Long Term Bank Loan | 9 | 247,974,973 | 266,084,154 |
| **Current Liabilities** | |||
| Working Capital Loan | 10 | 248,749,477 | 318,893,290 |
| Current Portion of Term Loan | 11 | 44,448,344 | 47,694,329 |
| Creditors | 12 | 15,319,337 | 7,639,103 |
| **Total Current Liabilities** | **308,517,158** | **374,226,722** | |
| **TOTAL EQUITY AND LIABILITIES** | **828,880,404** | **877,344,918** |
2.2 Statement of Profit or Loss and Other Comprehensive Income
| Particulars | Note | FY 30.06.2026 (BDT) | FY 30.06.2025 (BDT) |
| Export Sales | 548,927,697 | 525,456,653 | |
| Less: Direct Expenses | 13 | 459,614,746 | 440,347,366 |
| **Gross Profit** | **89,312,950** | **85,109,287** | |
| Administrative Expenses | 14 | 16,105,918 | 16,896,234 |
| Financial Expenses | 15 | 32,861,028 | 35,163,999 |
| **Operating Profit** | **40,346,005** | **33,049,054** | |
| Add: Cash Incentive | 0 | 11,391,400 | |
| Add: Bank and FDR Interest | 16 | 667,789 | 1,003,657 |
| **Net Profit before Tax** | **41,013,794** | **45,444,110** | |
| Less: Tax Provision (Business Income, Cash Incentive, Interest) | 5,659,563 | 6,669,712 | |
| **Net Profit after Tax** | **35,354,231** | **38,774,398** | |
| Add: Accumulated Profit Brought Forward | 177,034,042 | 138,259,644 | |
| **Balance Carried to Balance Sheet** | **212,388,272** | **177,034,042** |
2.3 Statement of Changes in Equity
| Particulars | Share Capital | Reserve & Surplus | Retained Earnings | Total Equity |
| Balance as on 01.07.2025 | 60,000,000 | 0 | 177,034,042 | 237,034,042 |
| Add: Net Profit after Tax | 0 | 0 | 35,354,231 | 35,354,231 |
| **Balance as on 30.06.2026** | **60,000,000** | **0** | **212,388,272** | **272,388,272** |
2.4 Statement of Cash Flows
| Particulars | FY 30.06.2026 (BDT) | FY 30.06.2025 (BDT) |
| **A. Cash Flows from Operating Activities** | ||
| Export Earnings | 548,927,697 | 525,456,653 |
| Payment for Expenses | (508,581,692) | (492,407,600) |
| Cash Incentive | 0 | 11,391,400 |
| Interest Income | 667,789 | 1,003,657 |
| Depreciation | 17,291,712 | 19,213,013 |
| Provision for Income Tax | (5,659,563) | (6,669,712) |
| **Cash Generated before Working Capital Changes** | **52,645,942** | **57,987,410** |
| Net Changes in Creditors | 7,680,235 | (1,184,897) |
| Net Changes in Advance, Deposits & Receivables | (17,508,885) | (65,328,783) |
| Net Changes in Inventory | (2,968,007) | 2,409,999 |
| **Net Cash from Operating Activities** | **39,849,285** | **(6,116,271)** |
| **B. Cash Flows from Investing Activities** | ||
| Acquisition of Fixed Assets / Disposal | 0 | 0 |
| **Net Cash Used in Investing Activities** | **0** | **0** |
| **C. Cash Flows from Financing Activities** | ||
| Long Term Bank Loan – Increase/(Decrease) | (18,109,181) | (95,510,652) |
| Working Capital Loan – Increase/(Decrease) | (70,143,813) | 112,214,883 |
| Current Portion of Term Loan – Increase/(Decrease) | (3,245,985) | (16,914,815) |
| **Net Cash from Financing Activities** | **(91,498,979)** | **(210,583)** |
| **D. Net Change in Cash (A+B+C)** | **(51,649,695)** | **(6,326,854)** |
| Cash at Beginning of Year | 133,202,526 | 139,529,380 |
| **Cash at End of Year** | **81,552,831** | **133,202,526** |
3. Financial Analysis
3.1 Liquidity Analysis
The Company’s short-term liquidity position improved year-on-year. The current ratio rose to 2.11x (FY2025: 1.83x) and the quick ratio to 1.72x (FY2025: 1.51x), both indicating a strong capacity to cover current liabilities from current assets even after excluding inventory. The cash ratio, however, fell to 0.26x (FY2025: 0.36x), showing that while overall liquidity is strong, the proportion held in immediately available cash has reduced as funds were redirected to loan repayment.
3.2 Solvency Analysis
Leverage improved meaningfully. The debt ratio (total liabilities / total assets) fell to 67.1% (FY2025: 73.0%), and debt-to-equity improved to 2.04x (FY2025: 2.70x). This reflects a genuine deleveraging trend — total interest-bearing and trade liabilities fell from BDT 640.3 million to BDT 556.5 million — which reduces financial risk and interest burden going forward, consistent with the fall in financial expenses (BDT 32.86 million vs BDT 35.16 million).
3.3 Working Capital Analysis
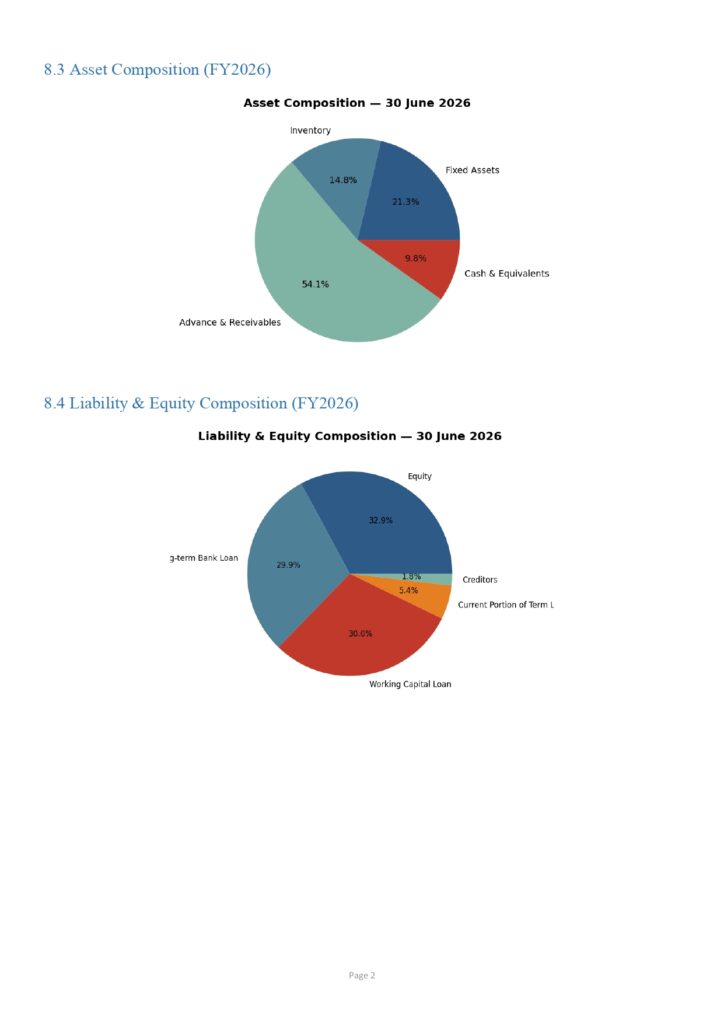
Net working capital increased to BDT 343.6 million (FY2025: BDT 309.1 million), a positive trend. Within working capital, advances, deposits and receivables of BDT 448.1 million represent the dominant asset class (68.7% of current assets), considerably larger than inventory (18.8%) and cash (12.5%). Management should assess the ageing and recoverability of this balance, as a large non-cash component can mask true liquid strength.
3.4 Cash Position Analysis
Operating cash flow swung from a negative BDT (6.1) million in FY2025 to a positive BDT 39.8 million in FY2026 — the single most significant positive development in the year. This was driven by a much smaller increase in receivables (BDT 17.5 million vs BDT 65.3 million growth in the prior year) and a positive swing in creditors. The Company used this operating cash, together with drawing down cash reserves, to fund BDT 91.5 million of net debt repayment, since there was no investing activity.
3.5 Debt Analysis
Total borrowings (long-term loan, working capital loan and current portion) fell from BDT 632.7 million to BDT 541.2 million, a reduction of BDT 91.5 million (14.5%), fully consistent with the financing section of the cash flow statement. This is a materially deleveraging balance sheet.
3.6 Trend & Year-on-Year Comparison
| Metric | FY 2026 | FY 2025 | YoY Change |
| Export Sales (BDT) | 548,927,697 | 525,456,653 | 4.5% |
| Gross Profit (BDT) | 89,312,950 | 85,109,287 | 4.9% |
| Operating Profit (BDT) | 40,346,005 | 33,049,054 | 22.1% |
| Net Profit after Tax (BDT) | 35,354,231 | 38,774,398 | -8.8% |
| Operating Cash Flow (BDT) | 39,849,285 | (6,116,271) | Turned positive |
| Total Assets (BDT) | 828,880,404 | 877,344,918 | -5.5% |
| Total Equity (BDT) | 272,388,272 | 237,034,042 | 14.9% |
| Cash & Equivalents (BDT) | 81,552,831 | 133,202,526 | -38.8% |
3.7 Variance Analysis — Key Drivers
- Net profit variance of BDT (3.42) million is fully attributable to the non-recurrence of the FY2025 cash incentive of BDT 11.39 million; excluding this one-off, underlying profitability improved.
- The BDT 45.97 million favourable swing in operating cash flow is driven primarily by receivables growth slowing from BDT 65.3 million to BDT 17.5 million.
- Financing outflow increased from BDT 0.21 million (FY2025) to BDT 91.50 million (FY2026) as management prioritised deleveraging over cash retention.
4. Key Financial Ratios
| Ratio | Formula | FY 2026 | FY 2025 | Benchmark |
| Current Ratio | Current Assets ÷ Current Liabilities | 2.11x | 1.83x | 1.0x – 2.0x |
| Quick Ratio | (Current Assets – Inventory) ÷ Current Liabilities | 1.72x | 1.51x | >1.0x |
| Cash Ratio | Cash & Equivalents ÷ Current Liabilities | 0.26x | 0.36x | >0.2x |
| Debt Ratio | Total Liabilities ÷ Total Assets | 67.1% | 73.0% | <60% |
| Debt-to-Equity | Total Liabilities ÷ Total Equity | 2.04x | 2.70x | <1.5x |
| Working Capital Ratio | (CA – CL) ÷ Current Liabilities | 1.11x | 0.83x | Positive |
| Cash Conversion Ratio | Operating Cash Flow ÷ Net Profit | 1.13x | (0.16x) | >0.8x |
| Operating Cash Flow Ratio | Operating Cash Flow ÷ Current Liabilities | 0.13x | (0.02x) | >0.1x |
Profitability Ratios (supplementary)
| Ratio | FY 2026 | FY 2025 |
| Gross Profit Margin | 16.3% | 16.2% |
| Operating Profit Margin | 7.3% | 6.3% |
| Net Profit Margin | 6.4% | 7.4% |
| Return on Equity (ROE) | 13.0% | 16.4% |
| Return on Assets (ROA) | 4.3% | 4.4% |
| Earnings Per Share (EPS) | BDT 58.92 | BDT 64.62 |
| Net Asset Value (NAV) per Share | BDT 453.98 | BDT 395.06 |
5. Risk Assessment
5.1 Liquidity Risk — Low to Moderate
Overall ratio-based liquidity is strong (current ratio 2.11x). Risk arises because 68.7% of current assets are locked in advances/deposits/receivables rather than cash; if any portion proves slow-moving or unrecoverable, effective liquidity would be materially weaker than the reported ratios suggest.
5.2 Cash Flow Risk — Low, improving
Operating cash flow turned positive and now covers net profit 1.13x, a healthy sign of earnings quality. Risk remains around the sustainability of receivables collection given the very large advances/deposits and receivables balance (BDT 448.1 million).
5.3 Credit Risk — Moderate
A very high proportion of current assets sits in ‘Other deposits and receivable (Net)’ (BDT 439.8 million per Note 6), which is not broken down by counterparty ageing in the source data. Concentration or collection risk cannot be ruled out without an ageing schedule; this should be obtained and reviewed.
5.4 Financial Stability / Leverage Risk — Moderate, improving
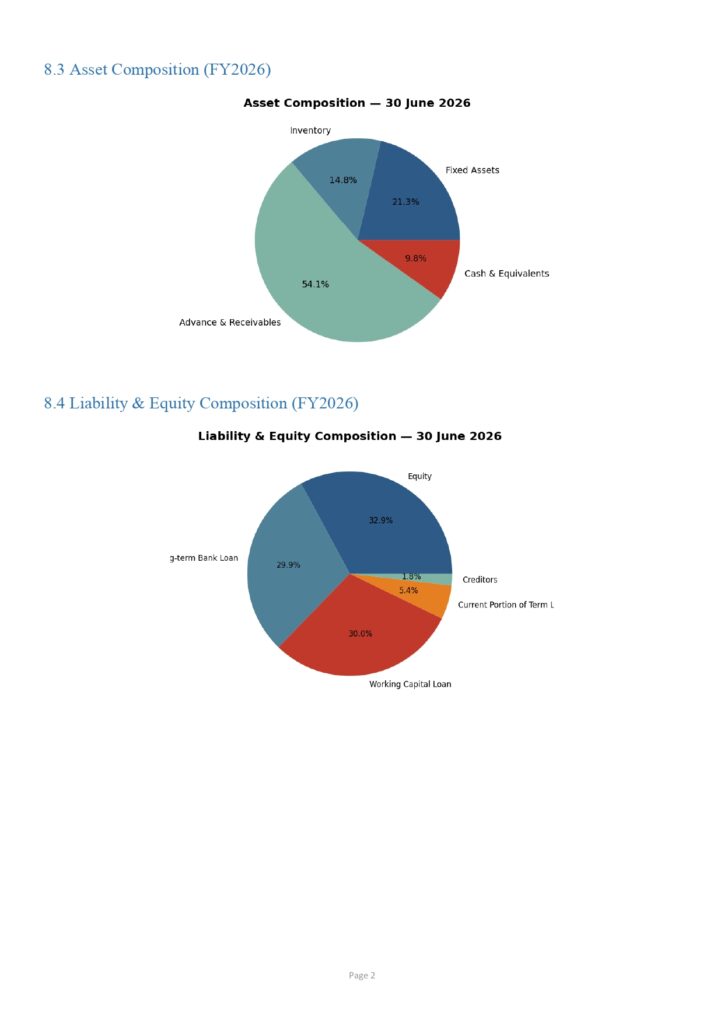
Debt-to-equity of 2.04x remains above conventional comfort levels (typically <1.5x) despite significant improvement from 2.70x. The Company still carries substantial working capital and term loan exposure (BDT 541.2 million total borrowings) relative to equity of BDT 272.4 million.
5.5 Going Concern
No going concern indicators are evident. The Company is profitable at the operating level, generating positive operating cash flow, actively deleveraging, and equity grew 14.9% during the year. Continued monitoring of receivables realisability and cash reserves (which fell 38.8%) is warranted.
6. Management Recommendations
6.1 Improving Cash Flow
- Obtain and review an ageing schedule for the BDT 448.1 million advances, deposits and receivables balance; set collection targets for balances aged beyond 90 days.
- Consider negotiating shorter buyer/export credit terms or factoring/bill discounting facilities to accelerate conversion of receivables to cash.
6.2 Reducing Costs
- Financial expenses fell from BDT 35.16 million to BDT 32.86 million on lower average borrowings — continue the deleveraging trajectory to compound this benefit in FY2027.
- Benchmark administrative expenses (down 4.7% YoY) against industry peers to identify further efficiency opportunities without compromising controls.
6.3 Strengthening Liquidity
- Rebuild a minimum operating cash buffer (e.g., 1–2 months of direct expenses) before further discretionary debt prepayment, given cash fell 38.8% during the year.
- Explore a committed but undrawn working capital facility as a liquidity backstop rather than relying solely on cash on hand.
6.4 Optimising Working Capital
- Continue the FY2026 improvement in receivables growth discipline (BDT 17.5 million increase vs BDT 65.3 million in FY2025) as a standing KPI for the finance team.
- Review inventory turnover to ensure the BDT 122.5 million inventory balance is not building beyond production/export requirements.
6.5 Improving Financial Performance
- Since the reported NPAT decline is a one-off other-income effect, communicate underlying operating profit growth (+22.1%) clearly to the Board, bank and investors to avoid a misleading headline impression.
6.6 Strengthening Internal Controls
- Correct the immaterial BDT 0.04–0.07 balance sheet rounding difference in the underlying workbook and formally reconcile Total Assets to Total Equity & Liabilities to zero before the statements are issued externally.
- Introduce a formal ageing and counterparty reconciliation process for the ‘Other deposits and receivable (Net)’ balance, given its size relative to the balance sheet.
7. Dashboard
7.1 Executive KPI Table
| KPI | Value | Status |
| Operating Cash Flow | BDT 39.85 million (positive) | Excellent |
| Net Cash Position (Closing Cash) | BDT 81.55 million | Watch |
| Current Ratio | 2.11x | Strong |
| Quick Ratio | 1.72x | Strong |
| Debt-to-Equity | 2.04x | Acceptable |
| Working Capital | BDT 343.61 million (positive) | Good |
| Revenue Growth | +4.47% | Good |
| Operating Margin | 7.35% | Good |
| Net Profit Margin | 6.44% | Acceptable |
| Total Debt Reduction | BDT 91.50 million repaid | Excellent |
7.2 Financial Highlights — Monthly/Annual Summary
| Highlight | FY 2026 | FY 2025 |
| Export Sales | 548,927,697 | 525,456,653 |
| Gross Profit | 89,312,950 | 85,109,287 |
| Operating Profit | 40,346,005 | 33,049,054 |
| Net Profit after Tax | 35,354,231 | 38,774,398 |
| Total Assets | 828,880,404 | 877,344,918 |
| Total Equity | 272,388,272 | 237,034,042 |
| Closing Cash | 81,552,831 | 133,202,526 |
7.3 Variance Table
| Line Item | FY 2026 | FY 2025 | Variance (BDT) | Variance % |
| Export Sales | 548,927,697 | 525,456,653 | 23,471,044 | 4.5% |
| Gross Profit | 89,312,950 | 85,109,287 | 4,203,664 | 4.9% |
| Net Profit after Tax | 35,354,231 | 38,774,398 | (3,420,167) | -8.8% |
| Total Borrowings | 541,172,794 | 632,671,773 | (91,498,980) | -14.5% |
| Cash & Equivalents | 81,552,831 | 133,202,526 | (51,649,695) | -38.8% |
8. Charts
8.1 Cash Balance Trend
8.2 Revenue vs Expense vs Profit
8.3 Asset Composition (FY2026)
8.4 Liability & Equity Composition (FY2026)
8.5 Working Capital Trend
8.6 Operating Cash Flow Trend
9. Final Conclusion
Ready-Made Garments (RMG) Industry in Bangladesh
closed FY2025-26 in a fundamentally stronger operating and financial position than the headline net profit figure suggests. Export revenue grew 4.47%, gross and operating margins expanded, and — most significantly — operating cash flow reversed from negative BDT (6.1) million to a positive BDT 39.85 million, funding a substantial BDT 91.5 million reduction in total borrowings and lifting shareholders’ equity by 14.9% to BDT 272.4 million.
The apparent 8.82% decline in net profit after tax is not an operating weakness; it is fully explained by the non-recurrence of a prior-year one-off cash incentive of BDT 11.39 million. Underlying operating profit in fact grew 22.08%.
Liquidity ratios (current 2.11x, quick 1.72x) are strong, and leverage has improved (debt-to-equity down from 2.70x to 2.04x), though it remains above conventional comfort levels and warrants continued deleveraging. The principal watch item is the concentration of current assets in advances, deposits and receivables (68.7% of current assets) alongside a 38.8% reduction in cash reserves — both should be actively managed in FY2026-27 to protect liquidity while the Company continues to reduce debt.
Overall Rating: Positive / Improving, with liquidity concentration and cash-buffer rebuilding flagged for management attention.
Suitable For
- CFO / CEO / Managing Director — operational and strategic decision-making
- Board of Directors — governance oversight
- Bank / Lenders — credit and covenant monitoring
- Investors / Shareholders — performance and value assessment
RELATED POSTS
View all